The rental market is changing rapidly. This index from the National Multifamily Housing Council (NMHC) has been an excellent leading indicator for rents and vacancy rates, and this suggests higher vacancy rates and slower rent growth in the coming months.
From the NMHC: Apartment Market Softens, Sales Put on Hold Amidst Rising Rates and Economic Uncertainty
“The physical apartment market is also starting to normalize after six consecutive quarters of tightening conditions, with a majority of survey respondents reporting higher vacancy and lower rent growth compared to the three months prior.”
Market Tightness Index came in at 20 this quarter — well below the breakeven level (50) — indicating looser market conditions for the first time in six quarters. The majority of respondents (66%) reported markets to be looser than three months ago, while only 5% thought markets have become tighter. The remaining 29% of respondents thought that market conditions were unchanged over the past three months, a considerable decline from the 56% of respondents who said the same in July.

And from ApartmentList.com: Apartment List National Rent Report
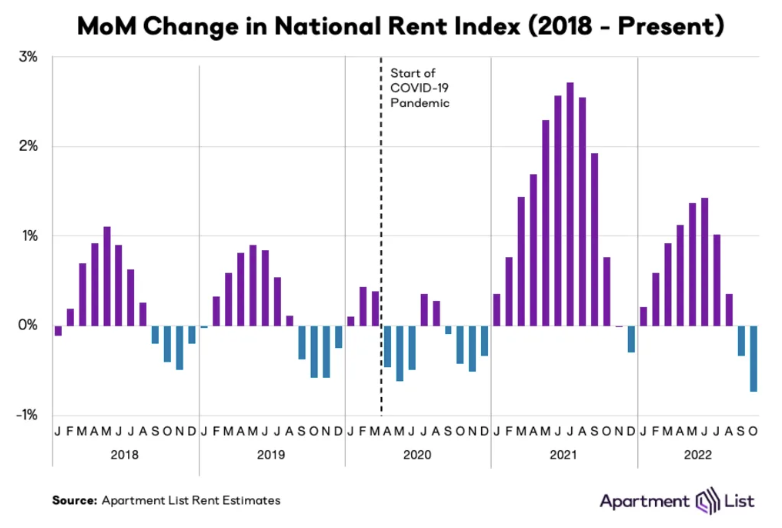
Welcome to the November 2022 Apartment List National Rent Report. Our national index fell by 0.7 percent over the course of October, marking the second straight month-over-month decline, and the largest single month dip in the history of our index, going back to 2017. These past two months have marked a rapid cooldown in the market, but the timing of that cooldown is consistent with a seasonal trend that was typical in pre-pandemic years. Going forward it is likely that rents will continue falling in the coming months as we enter the winter slow season for the rental market.
Despite the monthly decline, rent growth over the course of this year continues to outpace the pre-pandemic trend, even as it has slowed significantly from last year’s peaks. So far in 2022 rents are up by a total of 5.9 percent, compared to 18 percent at this point in 2021. Year-over-year growth has decelerated rapidly since the start of the year, but it’s still likely that 2022 will end up being the second fastest year of rent growth since the start of our estimates.
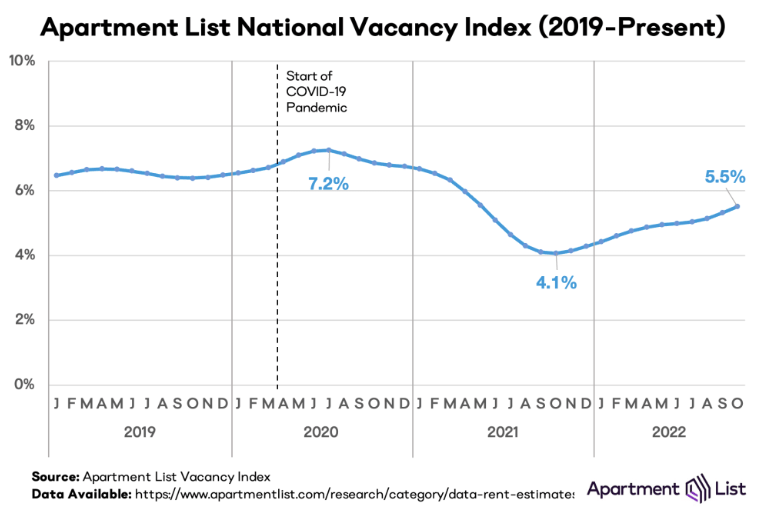
The cooldown in rent growth is being mirrored by continued easing on the supply side of the market. Our vacancy index now stands at 5.5 percent, after a full year of gradual increases from a low of 4.1 percent last fall. In the past two months, this easing of the vacancy rate has picked up steam again, after plateauing a bit over the summer. That said, today’s vacancy rate remains below the pre-pandemic norm.
Rents appear to be decreasing more than just seasonally.
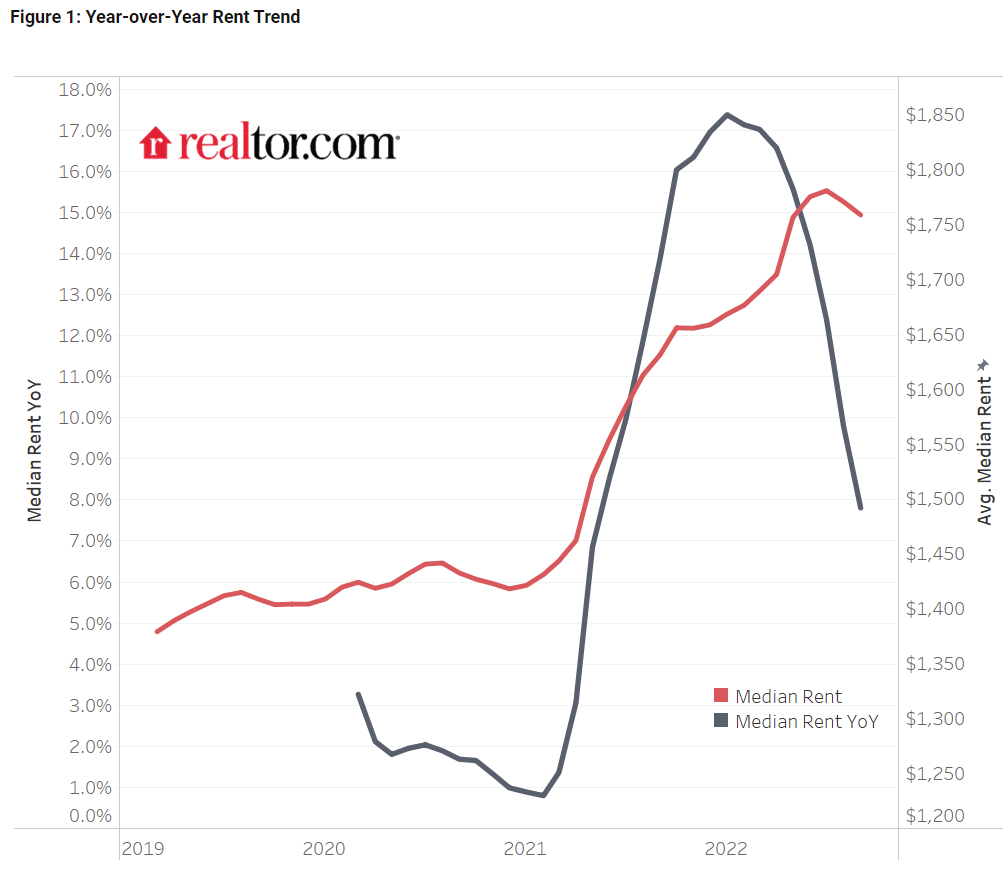
From Realtor.com: September Rental Report: Rent Growth Continues to Cool
In September 2022, the U.S. rental market experienced single-digit growth for the second month in a row. The median rent growth across the top 50 metros slowed to 7.8% year-over-year for 0-2 bedroom properties. It is the lowest growth rate in 16 months but is still more than two times faster than the growth rate seen just before the pandemic hit in March 2020. The median asking rent was $1,759, down by $12 from last month and $22 from the peak.
CoreLogic also tracks rents for single family homes: US Rent Growth Continues to Slow in August, CoreLogic Reports
U.S. single-family home rental costs posted an 11.4% year-over-year increase in August, marking the fourth straight month of annual deceleration. Even so, rental costs remained elevated, with annual growth running at about five times the rate than in August 2020 in the midst of the COVID-19 pandemic. …
“Single-family rent prices in August were 26% higher than before the onset of the pandemic, adding an average of $400 per month to tenants’ monthly costs and compounding other household expenses caused by inflation,” said Molly Boesel, principal economist at CoreLogic. “While annual rent growth is projected to continue increasing throughout the rest of 2022, those gains will likely moderate further in 2023.”
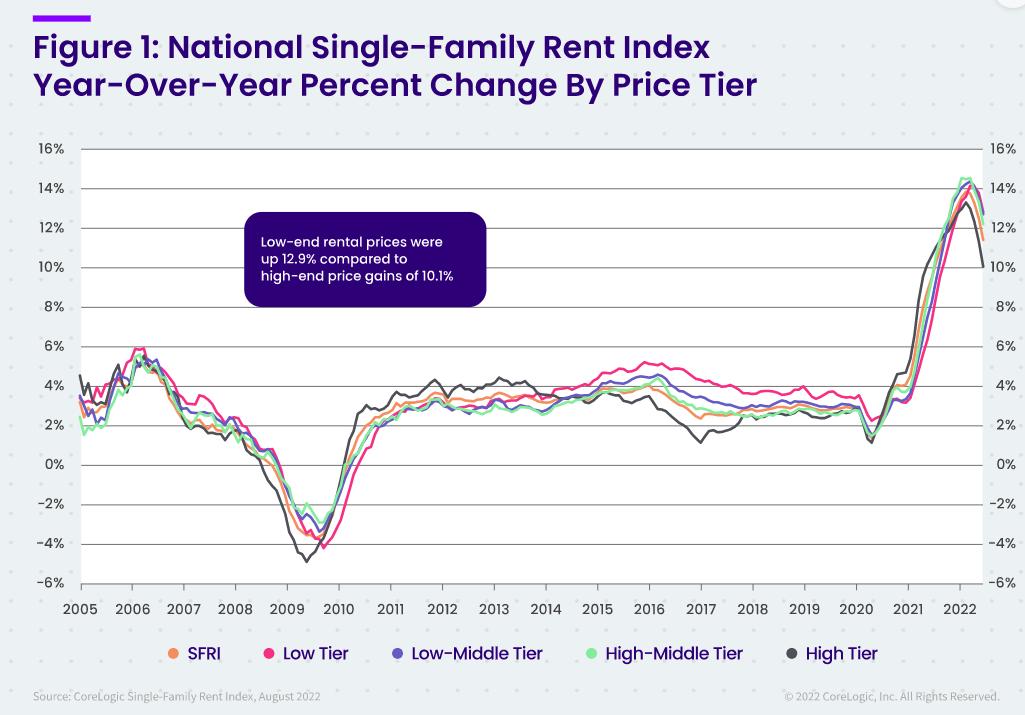
The 11.4% YoY increase in August was down from 12.6% in July.
Rent Data
I’m going to update some of the data on rents. Here is a graph of several measures of rent since 2000: OER, rent of shelter, rent of primary residence, Zillow Observed Rent Index (ZORI), and ApartmentList.com. (All set to 100 in January 2017)
Note: For a discussion on how OER, and Rent of primary residence are measured, see from the BLS: How the CPI measures price change of Owners’ equivalent rent of primary residence (OER) and rent of primary residence (Rent)
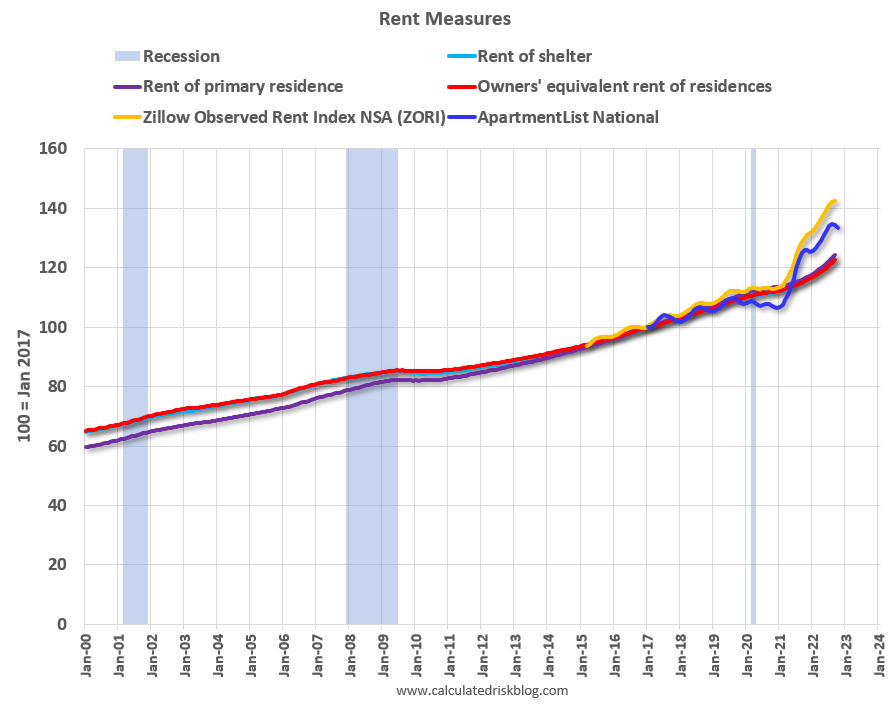
OER, rent of shelter, and rent of primary residence have mostly moved together. The Zillow index started in 2014, and the ApartmentList index started in 2017.
Here is a graph of the year-over-year (YoY) change for these measures since January 2015. All of these measures are through September 2022 (Apartment List through October 2022).
Note that new lease measures (Zillow, Apartment List) dipped early in the pandemic, whereas the BLS measures were steady. Then new leases took off, and the BLS measures are picking up.
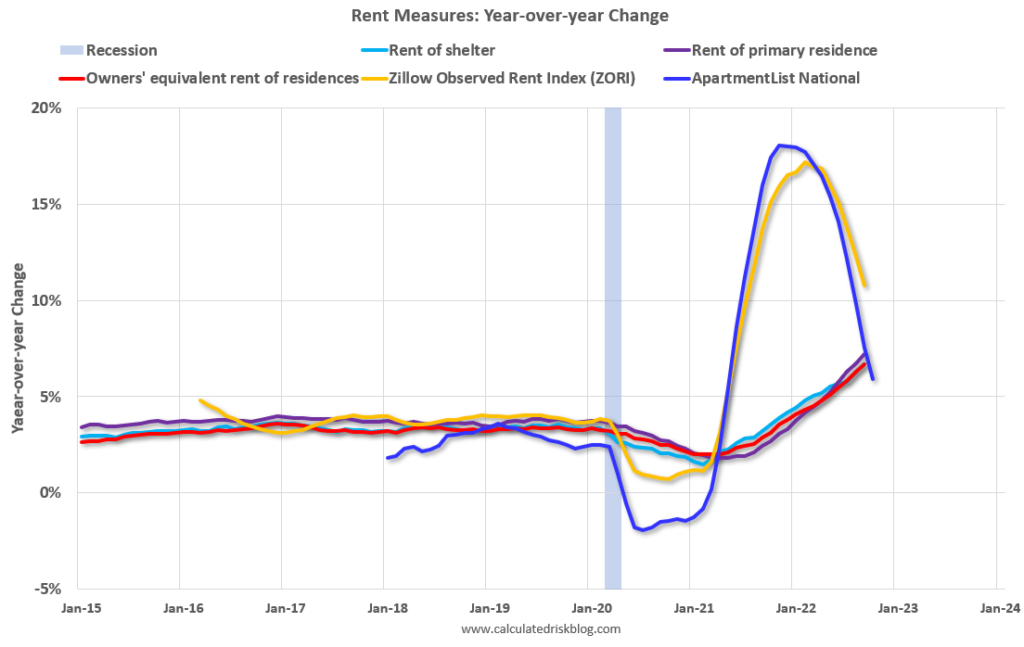
The Zillow measure is up 10.8% YoY in September, down from 12.3% YoY in August. This is down from a peak of 17.2% YoY in February.
The ApartmentList measure is up 5.9% YoY as of October, down from 7.5% in September. This is down from the peak of 18.0% YoY last November.
Both the Zillow measure (a repeat rent index), and ApartmentList are showing a slowdown in rental increases in rents. From Zillow:
“ZORI is a repeat-rent index that is weighted to the rental housing stock to ensure representativeness across the entire market, not just those homes currently listed for-rent.”
And from ApartmentList:
At Apartment List, we estimate the median contract rent across new leases signed in a given market and month. To capture how rents change in a market over time, we estimate the expected price change that a rental unit should experience if it were to be leased today.
Both of these measures reflect new leases, whereas most rental units don’t turnover every year (as captured by the BLS measures). This sharp increase in new lease rates should spill over into the consumer price index over the next year (as discussed in earlier article).
Rents are still increasing YoY, and we should expect this to continue to spill over into measures of inflation. The Owners’ Equivalent Rent (OER) was up 6.7% YoY in September, from 6.3% YoY in August – and will likely increase further in the coming months even as rents slow sharply.
Conclusion
My suspicion is rent increases will slow further over the coming months as the pace of household formation slows, and more supply comes on the market. Housing economist Tom Lawler recently wrote: “An actual decline in rents next year would be a reasonable base case”