As seen in CoStar
If Recent Movements Are Any Indication, Further Price Declines Lie Ahead.
Commercial real estate pricing cycles have recently run in periods of seven to 10 years and are usually accented by brief and hard-hitting bouts of volatility.
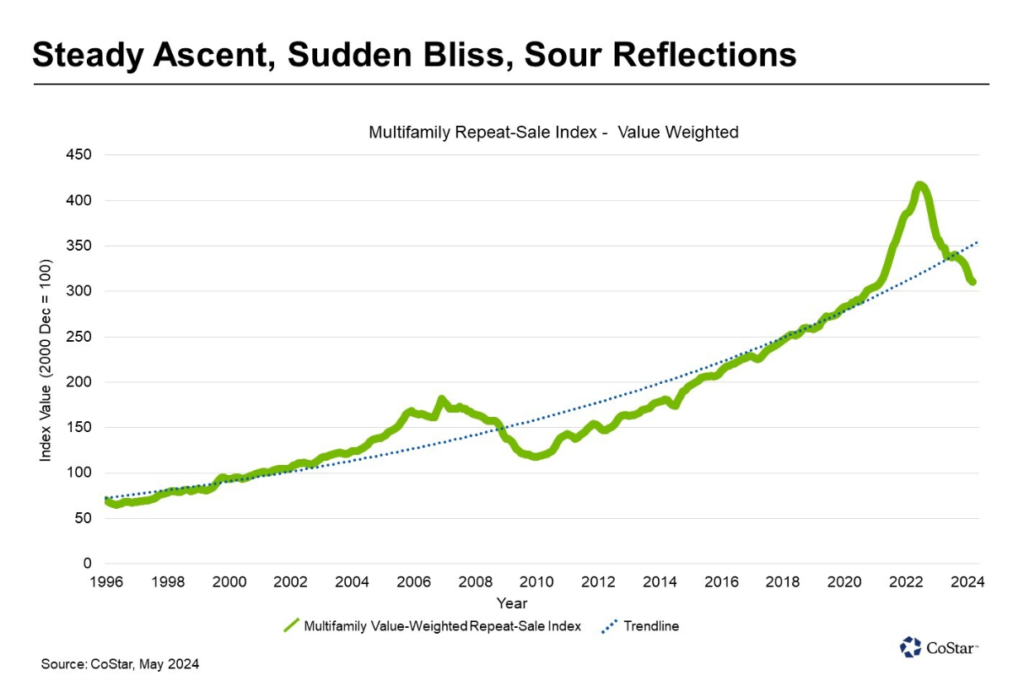
Since 1996, the multifamily price trend has increased at a compound rate of close to 6%. Take out the periods of irrational exuberance and consequent despair, and the compound price growth trend in times of relative economic normalcy, 1996 to 2004 or 2010 to 2020, is closer to 9%, excluding the added returns from cash flow.
Other than hotels, multifamily is the quickest of the major commercial real estate property types to react to economic fluctuations. The combination of short-term one-year lease agreements and the efficiency with which these investments are priced make sudden changes to either the unemployment rate or to Treasury yields quickly reflected in multifamily pricing.

Using CoStar’s Commercial Repeat Sales Index, from 1996 to 2004, the value-weighed multifamily index grew at a compound rate of more than 9% before accelerating above the trend from 2005 through early 2008. As the financial crisis began to take its toll, multifamily pricing dropped dramatically. During that slide, the index had a six-month hiccup as it passed through its trendline growth before resuming its descent into 2010.
A similar trend scenario unfolded in May of 2023, as the price adjustment from all-time pricing highs was in full swing. As it had done in the prior cycle, the index box-stepped nowhere for six months as it met the cycle’s price trend. From there, it headed lower. But the question is how much lower it could go.
As of March 2024, the value-weighted multifamily index was down 26% from its all-time high in July 2022. Given the length of time for a deal to go from contract to closing, the repeat sales captured in March were probably put under contract in January when the 10-year Treasury yield was somewhere between 3.9% and 4.1%.
As the primary index used to price fixed-rate multifamily loans, any increase in this rate should, in theory, reduce an investor’s ability to pay the same price for a property. As of mid-April, the yield on the 10-year Treasury stood at 4.7%, hinting that repeat sales captured in subsequent months should show further price declines, inching their way toward a 30% drop.
Back-of-the-envelope underwriting reaches a similar conclusion. Given the rise in vacancy and subsequent slowing of rent growth below that of persistently inflating operating expenses, one could assume net operating income, or NOI, growth would be close to flat compared to the peak — plus, it makes the math a little easier.
A multifamily property generating a constant NOI of $1 million divided by an assumed 3.75% capitalization rate, reflecting peak cycle dynamics, would equate to a purchase price of $26.67 million. Under the assumption that the NOI these days was flat compared with two years ago, applying a 5.25% cap rate would produce a price of $19.05 million, or a 29% reduction in value.
A growing body of evidence supporting a 25% to 30% current drawdown in multifamily prices in high-growth markets compared to the peak is mounting, including recent transactions, surveys of active owners and brokers, CoStar’s value-weighted repeat-sale index, and our rough underwriting estimate above.
Both rising interest rates and market participants indicate that while most of the increase in cap rates is probably finished, we still have more ground to cover. If investor yield requirements continue to increase, resulting from the higher borrowing costs and an uncertain path for near-term NOI growth, this range of value losses in high-growth markets could climb beyond 30% before the current correction is over.
Upside Risk Scenario
With multifamily construction starts now at a decade-low, the prevailing wisdom is that it will take a few short years before historically strong demand absorbs the excess supply once the current supply wave washes onshore.
At that point, we could be in an environment where excess demand gets back in the driver’s seat. Spiking rent increases due to a window of limited new supply would inevitably raise asset values.
Downside Risk Scenario
The other side of this speculation is predicting the knock-on effects of tectonic demographic shifts underfoot. Long-term trends point to an aging population and slower household formations.
Specifically, a recent study by the U.S. Census Bureau found that the population of dependents, those aged 0-15 and 65 and over, is outpacing the growth of the working-age population. Known as the dependency ratio, the Census Bureau noted that this rise in dependents was “driven by the growth of the 65-and-older population.” According to the Federal Reserve Bank of Atlanta, the number of “prime-age” working people aged 25-54 grew by 40,000 in 2022 compared to 2 million Americans reaching 65 and older.
Looking back five years from now, the trendline in multifamily pricing will probably reflect a combination of the upside and downside risk scenarios. The gravitational force of an aging population is too strong to remain in the background, and the 40,000 people entering prime-age working years aren’t enough to reach escape velocity.
At the same time, according to the National Apartment Association and the National Multifamily Housing Council, the U.S. will need to see approximately 4.3 million new apartments built over the next 10 years due to a recognized housing shortage and the pandemic-era impacts on the population and economy.


