NORTHPEAK CRE MARKET INSIGHT
July 2020 median asking rents for 1BR units declined 8.9% to $1,440 on a year-over-year basis in the Denver Market and declined on average $160 from their peak according to www.Zumper.com.The rents used in the calculation were apartment buildings, including new construction, and doesn’t include the asking rents for condos-for-rent, rooms, efficiency apartments, apartments with three or more bedrooms, and single-family houses.
Keith Hardy
Advisor
Email: Keith@NorthPeakCRE.com
Phone:303-396-9292

WOLFSTREET.com | Large-scale shifts triggered by work-from-home, staggering unemployment crisis, and oil-and-gas bust. Rents respond in real time.
Rental markets in the US are shifting in a massive way, with some of the most expensive cities, cities across the oil patch, college-focused cities, and tech and education hubs such as Boston booking sharp year-over-year rent declines. But 60 of the top 100 rental markets booked rent increases, and 23 of them booked double-digit increases.
San Francisco, the most expensive market, skids hard.
The median asking rent in San Francisco for one-bedroom apartments dropped again 2.4% in July from June, to $3,200. This brings the two-month decline to 4.8% and the 12-month decline to 11.8%. From the peak in June 2019 – which had barely eked past the prior record of October 2015 – the median asking rent has now plunged 14.0%. That’s a lot, very fast.
For two-bedroom apartments, the median asking rent dropped 3.0% in July from June, to $4,210, bringing the two-month decline to 4.8% and the 12-month decline to 12.1%. Since the peak in October 2015, the median asking rent for 2-BR apartments has now dropped 15.8%.
In terms of 1-BR apartments, this makes San Francisco the third-fastest dropping rental market among the top 100 rental markets in the US on a year-over-year basis, behind Syracuse, NY (-15.5%), and Madison, WI (-11.7%), but ahead of oil-patch cities Irving, TX (-9.6%) and Laredo, TX (-9.6%).
In terms of 2-BR apartments, San Francisco’s rents fell faster on a year-over-year basis than any other city.
Despite these declines, San Francisco remains the most expensive city to rent in, among the top 100 rental markets in the US, according to Zumper’s Rent Report. But in terms of ZIP codes, San Francisco doesn’t have the most expensive ones; there are some in Manhattan and in Los Angeles that are even more expensive.
Rents in San Francisco hat hit a ceiling in October 2015 and then spiraled down by close to 10% over the next year-and-a-half before the Trump bump kicked in and rents rose again. 2-BR rents never got back to their October peak, but 1-BR rent did briefly eke past it in June last year. Now the Trump bump has totally unwound, plus some, in just a few months.
What are “median asking rents?”
Median asking rent means that half of the asking rents are higher, and half are lower. “Asking rent” is the advertised rent. This is a measure of the current market, like the price tag in a store that can be changed to attract shoppers. Asking rent is not a measure of what tenants are currently paying on their existing leases or under rent control.
These rents are for apartments in apartment buildings, including new construction but do not include rents of single-family houses, condos-for-rent, rooms, efficiency apartments, and apartments with three or more bedrooms. The data is collected by Zumper from over 1 million active listings, including from Multiple Listings Service (MLS), in the 100 largest markets.
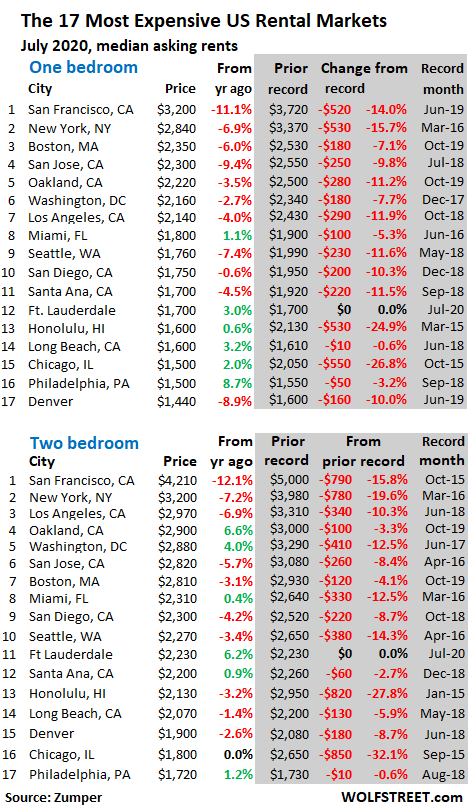
Red Ink in the 17 most expensive rental markets.
The table of the 17 most expensive major rental markets by median asking rents shows July rent, the change from July a year ago, and, in the shaded area, peak rent and change from the peak. The “declines from peak” are led by Chicago and Honolulu in the range of -25% to -32%, though they seem to have found a bottom recently. Numerous cities – including some of the formerly hottest markets – are have booked double-digit declines from their peaks. But Ft. Lauderdale set new records:
The 35 Cities with declines in 1-BR rents.
The table below shows the 35 cities among the top 100 rental markets with year-over-year rent declines in July for 1-BR apartments, led by college town Syracuse, NY, Madison, WI, and San Francisco. In addition to Silicon Valley’s San Jose and some other unicorn-startup-bubble hubs with a large university presence, such as Boston, there are a bunch of cities on this list that are in the hard-hit oil patch in Texas, Oklahoma, and Louisiana, with Texas being the epicenter of oil-and-gas company bankruptcy filings, and also being represented by seven entries on this list:
| Decliners | 1-BR | Y/Y % | |
| 1 | Syracuse, NY | $820 | -15.5% |
| 2 | Madison, WI | $1,060 | -11.7% |
| 3 | San Francisco, CA | $3,200 | -11.1% |
| 4 | Irving, TX | $1,030 | -9.6% |
| 5 | Laredo, TX | $750 | -9.6% |
| 6 | San Jose, CA | $2,300 | -9.4% |
| 7 | Denver, CO | $1,440 | -8.9% |
| 8 | Aurora, CO | $1,090 | -8.4% |
| 9 | Seattle, WA | $1,760 | -7.4% |
| 10 | New York, NY | $2,840 | -6.9% |
| 11 | Providence, RI | $1,400 | -6.7% |
| 12 | Charlotte, NC | $1,240 | -6.1% |
| 13 | Tulsa, OK | $620 | -6.1% |
| 14 | Boston, MA | $2,350 | -6.0% |
| 15 | Fort Worth, TX | $1,090 | -6.0% |
| 16 | Anaheim, CA | $1,650 | -4.6% |
| 17 | Orlando, FL | $1,240 | -4.6% |
| 18 | Santa Ana, CA | $1,700 | -4.5% |
| 19 | Virginia Beach, VA | $1,050 | -4.5% |
| 20 | Louisville, KY | $860 | -4.4% |
| 21 | Los Angeles, CA | $2,140 | -4.0% |
| 22 | Raleigh, NC | $1,040 | -3.7% |
| 23 | Salt Lake City, UT | $1,030 | -3.7% |
| 24 | Oakland, CA | $2,220 | -3.5% |
| 25 | Houston, TX | $1,110 | -3.5% |
| 26 | Pittsburgh, PA | $1,050 | -2.8% |
| 27 | Washington, DC | $2,160 | -2.7% |
| 28 | Spokane, WA | $830 | -2.4% |
| 29 | Corpus Christi, TX | $830 | -2.4% |
| 30 | New Orleans, LA | $1,400 | -2.1% |
| 31 | Durham, NC | $1,090 | -1.8% |
| 32 | Plano, TX | $1,150 | -1.7% |
| 33 | San Antonio, TX | $880 | -1.1% |
| 34 | Scottsdale, AZ | $1,420 | -0.7% |
| 35 | Minneapolis, MN | $1,390 | -0.7% |
The 35 Cities with the biggest rent increases in 1-BR rents.
In total, there were 60 cities with increases in 1-BR rents – compared to 35 cities with declines. So you can see where this is going: In aggregate, averaged out across the US, rents are rising. The table below shows the 35 cities with the biggest rent increases. The smallest increase among those 35 cities was 5.8% (Atlanta). In 23 cities, rents increased by the double digits. In 10 of them, rents increased by 15% or more! None of these 15-percenters are expensive rental markets, compared to San Francisco:
| Biggest Gainers | 1-BR | Y/Y % | |
| 1 | Cleveland, OH | $940 | 16.0% |
| 2 | Indianapolis, IN | $870 | 16.0% |
| 3 | Columbus, OH | $810 | 15.7% |
| 4 | St Petersburg, FL | $1,270 | 15.5% |
| 5 | Reno, NV | $1,050 | 15.4% |
| 6 | Chattanooga, TN | $900 | 15.4% |
| 7 | Cincinnati, OH | $900 | 15.4% |
| 8 | Baltimore, MD | $1,360 | 15.3% |
| 9 | St Louis, MO | $910 | 15.2% |
| 10 | Norfolk, VA | $920 | 15.0% |
| 11 | Lincoln, NE | $770 | 14.9% |
| 12 | Detroit, MI | $700 | 14.8% |
| 13 | Rochester, NY | $960 | 14.3% |
| 14 | Chesapeake, VA | $1,130 | 14.1% |
| 15 | Memphis, TN | $830 | 13.7% |
| 16 | Bakersfield, CA | $830 | 13.7% |
| 17 | Des Moines, IA | $920 | 13.6% |
| 18 | Newark, NJ | $1,290 | 12.2% |
| 19 | Boise, ID | $1,070 | 11.5% |
| 20 | Nashville, TN | $1,300 | 11.1% |
| 21 | Akron, OH | $610 | 10.9% |
| 22 | Sacramento, CA | $1,430 | 10.0% |
| 23 | Fresno, CA | $1,100 | 10.0% |
| 24 | Wichita, KS | $670 | 9.8% |
| 25 | Philadelphia, PA | $1,500 | 8.7% |
| 26 | Oklahoma City, OK | $750 | 8.7% |
| 27 | Arlington, TX | $890 | 8.5% |
| 28 | Gilbert, AZ | $1,310 | 8.3% |
| 29 | Tucson, AZ | $700 | 7.7% |
| 30 | Richmond, VA | $1,150 | 7.5% |
| 31 | Colorado Springs, CO | $1,000 | 7.5% |
| 32 | Winston Salem, NC | $820 | 6.5% |
| 33 | El Paso, TX | $690 | 6.2% |
| 34 | Buffalo, NY | $1,050 | 6.1% |
| 35 | Atlanta, GA | $1,470 | 5.8% |
The Big Shift.
This is still very early in the game, so to speak – the game being the consequences of the large-scale move to work-from-home which allows people to live anywhere for now, historic unemployment – over 30 million people are claiming state or federal unemployment insurance – and the oil-and-gas bust that has been washing over the producing regions. In addition, the unicorn-startup bubble already burst last year; and the Pandemic came on top of it.
So part of what we’re seeing is people leaving some expensive markets and moving to cheaper markets, maybe moving back home, or whatever, either because they lost their jobs or because they’re allowed to work from anywhere.
For renters in markets where rents are increasing 5% or 10% or 15% a year, this is going to get tough. In this environment, wages are unlikely to explode higher at this rate, even for the lucky ones who’re still working. Which leaves me wondering: How long can those rent increases in those markets be sustained? As along as the stimulus money keeps flowing?
Top 100 rental markets, most expensive to least expensive.
San Francisco tops the list; at the bottom are Tulsa, OK, and Akron, OH. The median asking rent in San Francisco – despite the sharp declines – is still over five times as expensive as in Akron and Tulsa.
The table shows 1-BR and 2-BR median asking rents. The cities are in order of the dollar-amount of 1-BR rents. You can search the list via the search box in your browser (if your smartphone clips this 6-column table on the right, hold your device in landscape position):
| City | 1-BR | Y/Y % | 2-BR | Y/Y % | |
| 1 | San Francisco, CA | $3,200 | -11.1% | $4,210 | -12.1% |
| 2 | New York, NY | $2,840 | -6.9% | $3,200 | -7.2% |
| 3 | Boston, MA | $2,350 | -6.0% | $2,810 | -3.1% |
| 4 | San Jose, CA | $2,300 | -9.4% | $2,820 | -5.7% |
| 5 | Oakland, CA | $2,220 | -3.5% | $2,900 | 6.6% |
| 6 | Washington, DC | $2,160 | -2.7% | $2,880 | 4.0% |
| 7 | Los Angeles, CA | $2,140 | -4.0% | $2,970 | -6.9% |
| 8 | Miami, FL | $1,800 | 1.1% | $2,310 | 0.4% |
| 9 | Seattle, WA | $1,760 | -7.4% | $2,270 | -3.4% |
| 10 | San Diego, CA | $1,750 | 0.0% | $2,300 | -4.2% |
| 11 | Fort Lauderdale, FL | $1,700 | 3.0% | $2,230 | 6.2% |
| 11 | Santa Ana, CA | $1,700 | -4.5% | $2,200 | 0.9% |
| 13 | Anaheim, CA | $1,650 | -4.6% | $2,000 | -10.3% |
| 14 | Long Beach, CA | $1,600 | 3.2% | $2,070 | -1.4% |
| 14 | Honolulu, HI | $1,600 | 0.6% | $2,130 | -3.2% |
| 16 | Chicago, IL | $1,500 | 2.0% | $1,800 | 0.0% |
| 16 | Philadelphia, PA | $1,500 | 8.7% | $1,720 | 1.2% |
| 18 | Atlanta, GA | $1,470 | 5.8% | $1,890 | 8.0% |
| 19 | Denver, CO | $1,440 | -8.9% | $1,900 | -2.6% |
| 20 | Sacramento, CA | $1,430 | 10.0% | $1,660 | 10.7% |
| 21 | Scottsdale, AZ | $1,420 | -0.7% | $1,900 | -5.5% |
| 22 | New Orleans, LA | $1,400 | -2.1% | $1,650 | 7.8% |
| 22 | Portland, OR | $1,400 | 3.7% | $1,750 | 2.9% |
| 22 | Providence, RI | $1,400 | -6.7% | $1,680 | 6.3% |
| 25 | Minneapolis, MN | $1,390 | -0.7% | $1,910 | 6.1% |
| 26 | Baltimore, MD | $1,360 | 15.3% | $1,620 | 14.1% |
| 27 | Gilbert, AZ | $1,310 | 8.3% | $1,520 | 3.4% |
| 28 | Nashville, TN | $1,300 | 11.1% | $1,410 | 4.4% |
| 29 | Newark, NJ | $1,290 | 12.2% | $1,740 | 16.0% |
| 30 | St Petersburg, FL | $1,270 | 15.5% | $1,630 | 5.2% |
| 30 | Austin, TX | $1,270 | 5.8% | $1,570 | 1.9% |
| 32 | Chandler, AZ | $1,260 | 4.1% | $1,440 | -1.4% |
| 33 | Dallas, TX | $1,250 | 1.6% | $1,700 | 0.0% |
| 34 | Charlotte, NC | $1,240 | -6.1% | $1,420 | 0.0% |
| 34 | Orlando, FL | $1,240 | -4.6% | $1,440 | -2.0% |
| 36 | Henderson, NV | $1,180 | 4.4% | $1,350 | 0.0% |
| 36 | Tampa, FL | $1,180 | 4.4% | $1,380 | 4.5% |
| 38 | Richmond, VA | $1,150 | 7.5% | $1,370 | 11.4% |
| 38 | Plano, TX | $1,150 | -1.7% | $1,550 | -4.9% |
| 40 | Chesapeake, VA | $1,130 | 14.1% | $1,250 | 2.5% |
| 41 | Houston, TX | $1,110 | -3.5% | $1,360 | -2.9% |
| 42 | Fresno, CA | $1,100 | 10.0% | $1,300 | 14.0% |
| 43 | Durham, NC | $1,090 | -1.8% | $1,250 | -1.6% |
| 43 | Aurora, CO | $1,090 | -8.4% | $1,370 | -8.7% |
| 43 | Fort Worth, TX | $1,090 | -6.0% | $1,350 | 3.8% |
| 46 | Boise, ID | $1,070 | 11.5% | $1,180 | 7.3% |
| 47 | Madison, WI | $1,060 | -11.7% | $1,320 | 0.0% |
| 48 | Phoenix, AZ | $1,050 | 5.0% | $1,290 | 3.2% |
| 48 | Reno, NV | $1,050 | 15.4% | $1,360 | 3.8% |
| 48 | Virginia Beach, VA | $1,050 | -4.5% | $1,260 | 2.4% |
| 48 | Pittsburgh, PA | $1,050 | -2.8% | $1,350 | 3.8% |
| 48 | Buffalo, NY | $1,050 | 6.1% | $1,350 | 14.4% |
| 53 | Raleigh, NC | $1,040 | -3.7% | $1,220 | 1.7% |
| 54 | Salt Lake City, UT | $1,030 | -3.7% | $1,280 | -6.6% |
| 54 | Irving, TX | $1,030 | -9.6% | $1,410 | -6.0% |
| 56 | Colorado Springs, CO | $1,000 | 7.5% | $1,300 | 8.3% |
| 56 | Las Vegas, NV | $1,000 | 1.0% | $1,250 | 8.7% |
| 58 | Milwaukee, WI | $990 | 2.1% | $1,130 | 10.8% |
| 59 | Anchorage, AK | $980 | 5.4% | $1,200 | 4.3% |
| 60 | Kansas City, MO | $960 | 1.1% | $1,160 | 8.4% |
| 60 | Mesa, AZ | $960 | 5.5% | $1,200 | 3.4% |
| 60 | Rochester, NY | $960 | 14.3% | $1,130 | 15.3% |
| 63 | Cleveland, OH | $940 | 16.0% | $1,000 | 14.9% |
| 64 | Jacksonville, FL | $930 | 1.1% | $1,100 | 4.8% |
| 65 | Norfolk, VA | $920 | 15.0% | $1,100 | 2.8% |
| 65 | Des Moines, IA | $920 | 13.6% | $990 | 15.1% |
| 67 | St Louis, MO | $910 | 15.2% | $1,280 | 11.3% |
| 68 | Chattanooga, TN | $900 | 15.4% | $1,030 | 15.7% |
| 68 | Cincinnati, OH | $900 | 15.4% | $1,200 | 7.1% |
| 70 | Arlington, TX | $890 | 8.5% | $1,180 | 8.3% |
| 71 | San Antonio, TX | $880 | -1.1% | $1,100 | 0.0% |
| 72 | Glendale, AZ | $870 | 1.2% | $1,100 | 0.0% |
| 72 | Indianapolis, IN | $870 | 16.0% | $930 | 14.8% |
| 74 | Louisville, KY | $860 | -4.4% | $960 | 0.0% |
| 75 | Omaha, NE | $840 | 1.2% | $1,040 | -1.0% |
| 76 | Memphis, TN | $830 | 13.7% | $880 | 8.6% |
| 76 | Spokane, WA | $830 | -2.4% | $1,050 | 5.0% |
| 76 | Baton Rouge, LA | $830 | 1.2% | $910 | 0.0% |
| 76 | Corpus Christi, TX | $830 | -2.4% | $1,060 | -0.9% |
| 76 | Bakersfield, CA | $830 | 13.7% | $1,030 | 14.4% |
| 81 | Winston Salem, NC | $820 | 6.5% | $900 | 8.4% |
| 81 | Knoxville, TN | $820 | 2.5% | $990 | 10.0% |
| 81 | Syracuse, NY | $820 | -15.5% | $1,050 | 0.0% |
| 84 | Columbus, OH | $810 | 15.7% | $1,050 | -4.5% |
| 85 | Tallahassee, FL | $790 | 3.9% | $910 | 3.4% |
| 85 | Augusta, GA | $790 | 5.3% | $880 | 6.0% |
| 87 | Lincoln, NE | $770 | 14.9% | $940 | 5.6% |
| 88 | Lexington, KY | $750 | 0.0% | $940 | -4.1% |
| 88 | Oklahoma City, OK | $750 | 8.7% | $900 | 1.1% |
| 88 | Laredo, TX | $750 | -9.6% | $880 | 0.0% |
| 91 | Greensboro, NC | $740 | 1.4% | $850 | 0.0% |
| 92 | Albuquerque, NM | $730 | 4.3% | $940 | 10.6% |
| 93 | Tucson, AZ | $700 | 7.7% | $900 | 1.1% |
| 93 | Detroit, MI | $700 | 14.8% | $800 | 15.9% |
| 95 | El Paso, TX | $690 | 6.2% | $800 | 1.3% |
| 96 | Wichita, KS | $670 | 9.8% | $720 | -4.0% |
| 97 | Shreveport, LA | $650 | 0.0% | $800 | 14.3% |
| 97 | Lubbock, TX | $650 | 3.2% | $810 | 1.3% |
| 99 | Tulsa, OK | $620 | -6.1% | $820 | 1.2% |
| 100 | Akron, OH | $610 | 10.9% | $720 | 1.4% |
Originally posted by Wolf Richter, Wolfstreet.com, Aug 3, 2020